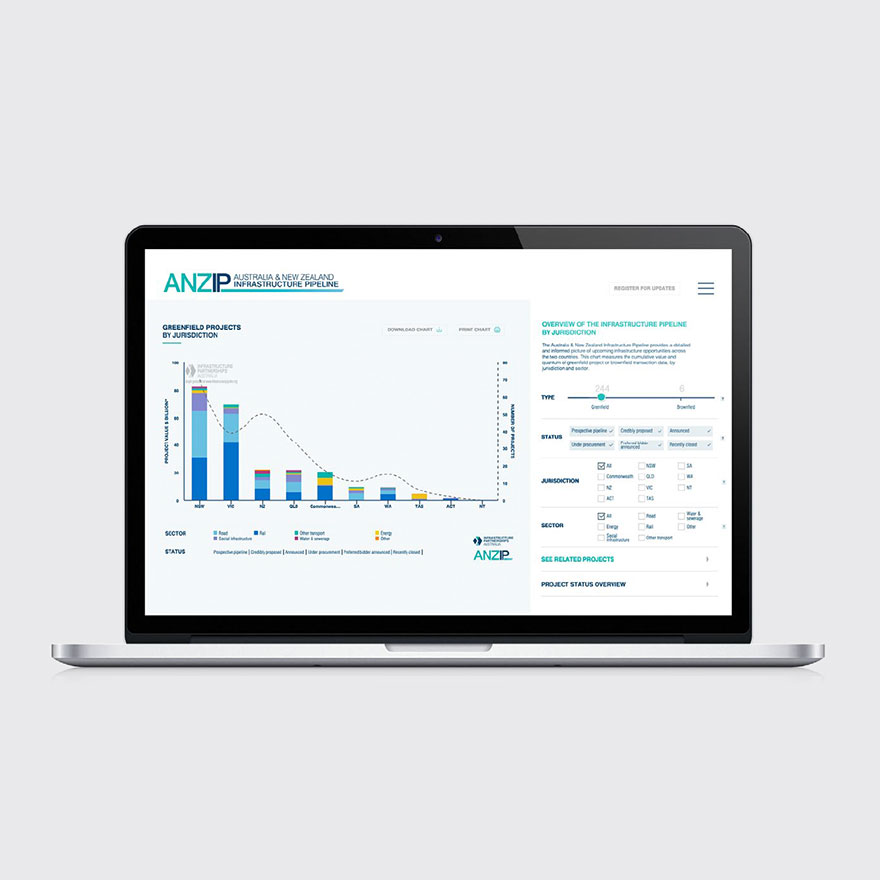
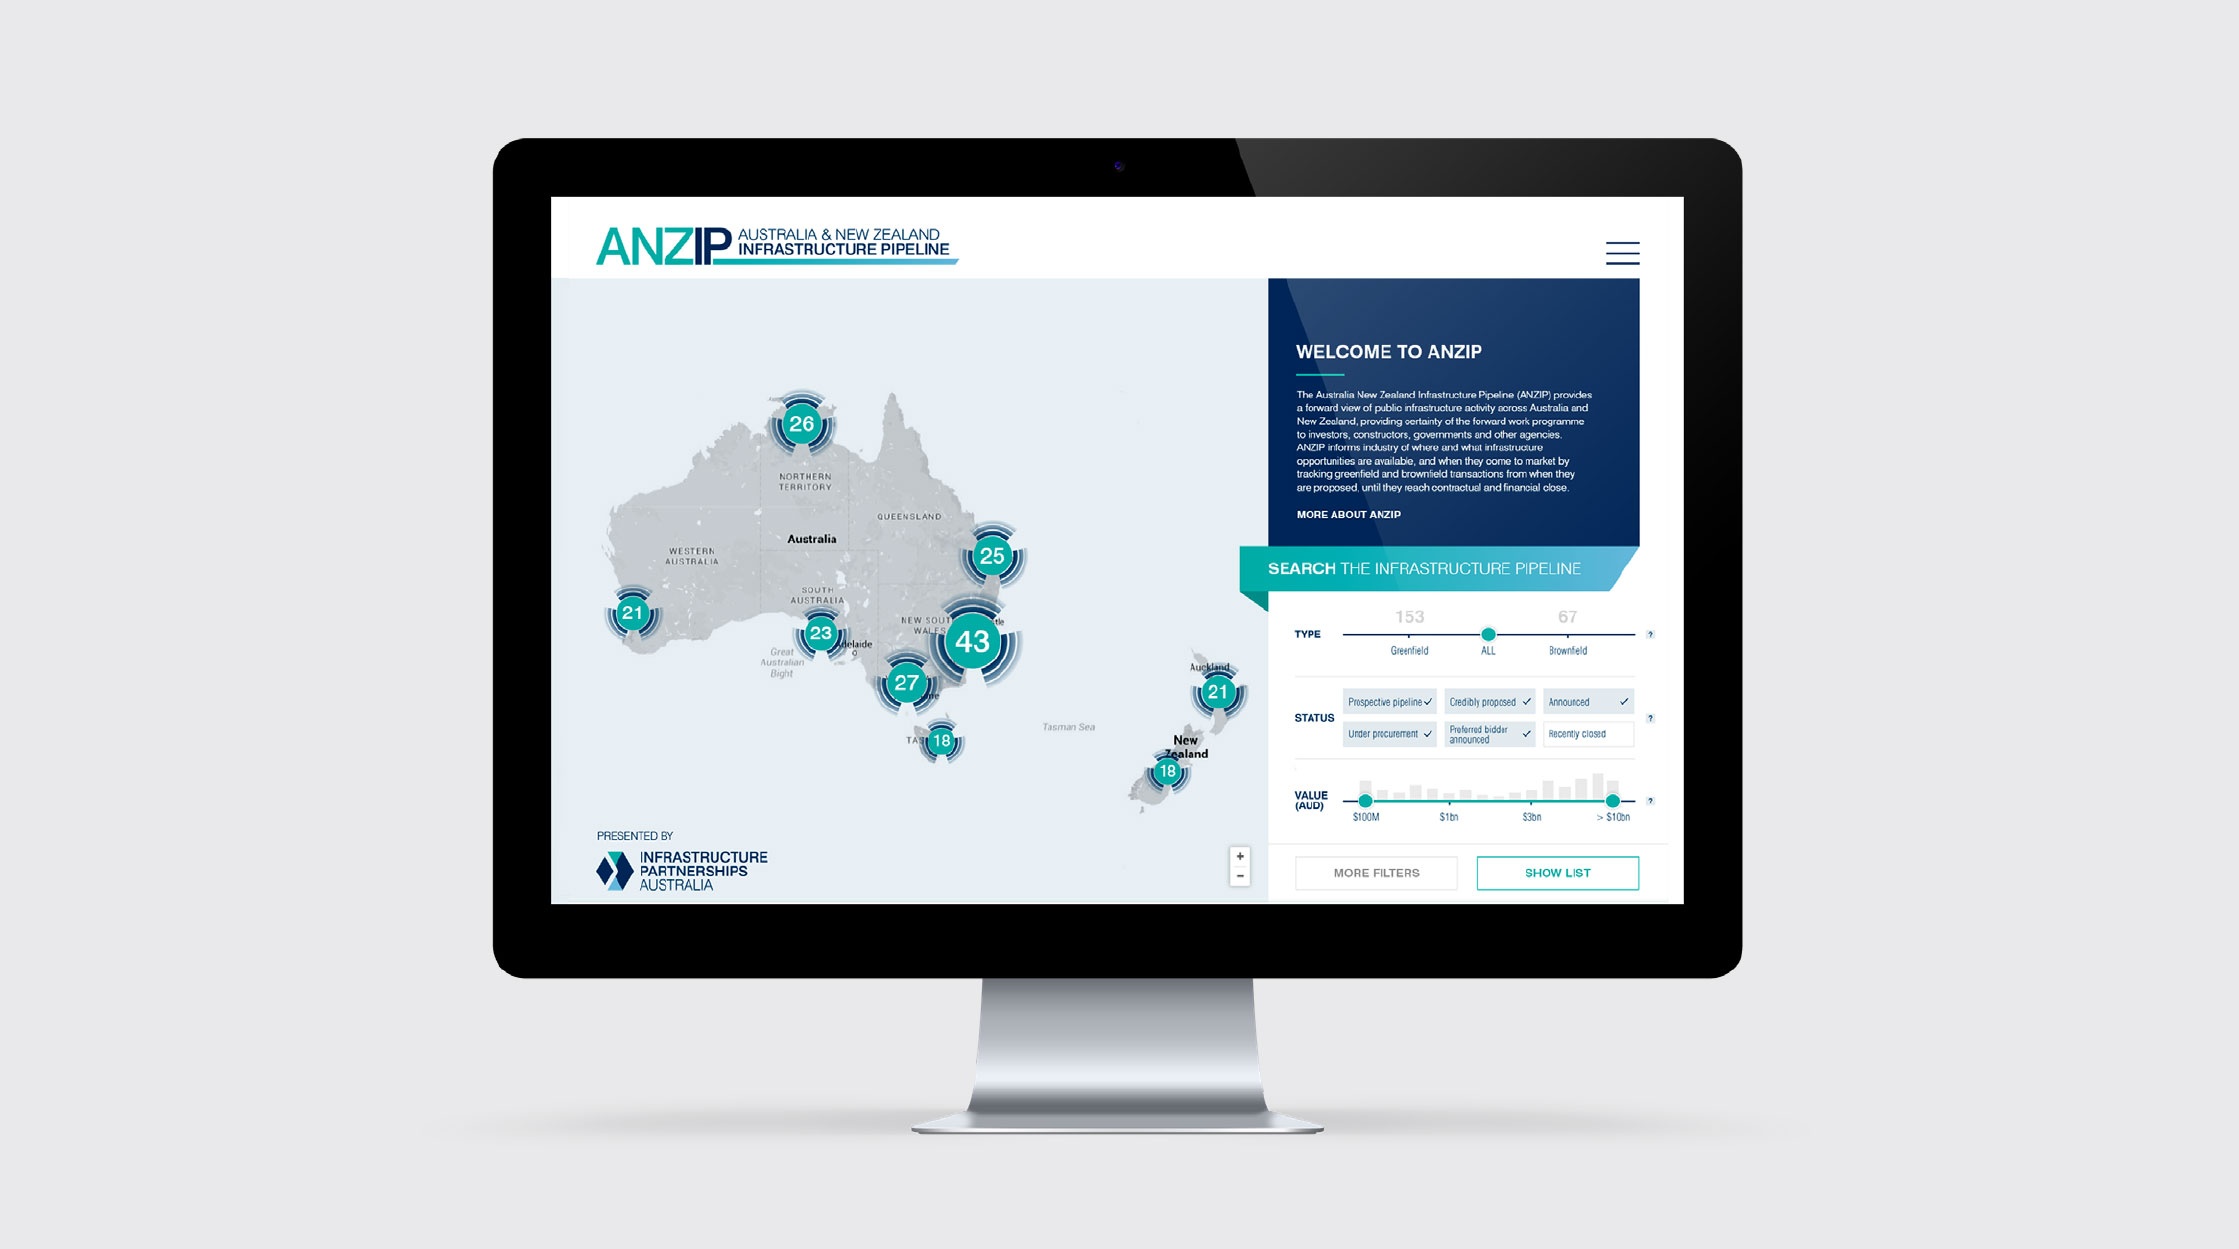
INFRASTRUCTURE PIPELINE WEBSITE AND DATA VISUALISATION

The Australia New Zealand Infrastructure Pipeline (ANZIP) website collects and organises complex, multi faceted infrastructure data and information, into an accessible and intuitive format that can then be repurposed as needed by the user.

OBJECTIVE

In a global context, Australia and New Zealand represent two of the most innovative and forward looking nations for the provision of economic and social infrastructure. Both countries need to keep up the momentum for innovation and investment to meet the demand for infrastructure in the face of population and economic growth. The goal was to create a comprehensive forward pipeline of projects to better incentivise firms to grow in the market due to the improved certainty and visibility of future projects. The focus was on ensuring an accessible and intuitive way to engage with the complex data to create a positive user experience, ensuring the pipeline would be a valuable tool for infrastructure planning.

SOLUTION

Customisable data visualisation was key to this project’s success, allowing the user to update and export in a variety of formats to use for a myriad of reporting purposes. Stylised Google mapping was used to inform the user of the volume of projects in various stages across Australia and New Zealand. Filters were designed around the most common search approaches to be as simple and intuitive as possible, and give instant visual feedback on the potential results. Any filter updates are instantly reflected on the map visual achieving a very responsive user experience. A graphing tool was developed to allow the users to generate dynamic and tailored charts which easily utilises the Infrastructure Pipeline data. The graphs illustrate key information by measuring infrastructure funding by jurisdiction; by measuring and forecasting construction activity across sectors; and by providing detailed data on Public Private Partnership (PPP) transactions.

RESULTS

91,000 Australian and New Zealanders have viewed infrastructurepipeline.org in the past year.

Over 200 projects currently on infrastructurepipeline.org

Every month they publish The Pipeline Report, an analysis and summary of movements on the pipeline – there are 6,000 subscribers.

Based on the success of this project, additional functionality will be rolled out to the site in 2020.

DELIVERABLES

Website planning workshop
Wireframes
User experience design
Website design and development
Data visualisation

© Tiny Hunter 2024 Privacy